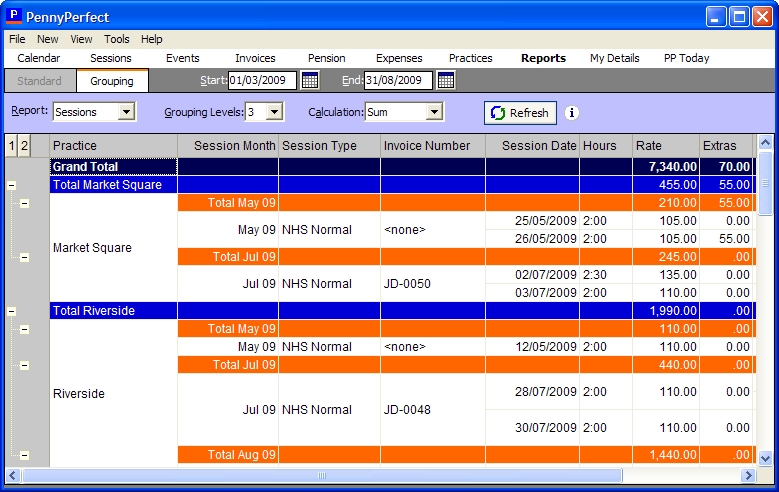
Grouping Report
Simplified analysis and custom reporting
The Grouping report allows data to be displayed for any period, and then grouped into various categories simply by dragging the column headers into different positions. The aggregate information for the groups can be chosen from Sum, Count, Max, Min, Average, and Percent.
This allows simple queries to be answered such as;
- What income did I receive from each practice, each month, in the last six months?
- What's the average I charge per session - comparison between different months or practices?
- Over the last 4 months, what percentage of my income has come from each practice?
- Whats the maximum number of days I've had to wait for an invoice to be paid from each practice?
To View a Report
- Enter the start date and end dates (inclusive) between which you want to view data.
- Select whether to view session or invoice data from the list.
- Click the Refresh button.
- To change how the data is grouped, drag a column header into a different position.
